Subsections of Install
Docker
Replace $YOURTIMEZONE with correct time zone and $YOURIFACE with network interface you want to scan. Network mode must be host. Set $DOCKERDATAPATH for container to save data:
docker run --name wyl \
	-e "IFACES=$YOURIFACE" \
	-e "TZ=$YOURTIMEZONE" \
	--network="host" \
	-v $DOCKERDATAPATH/wyl:/data/WatchYourLAN \
    aceberg/watchyourlan
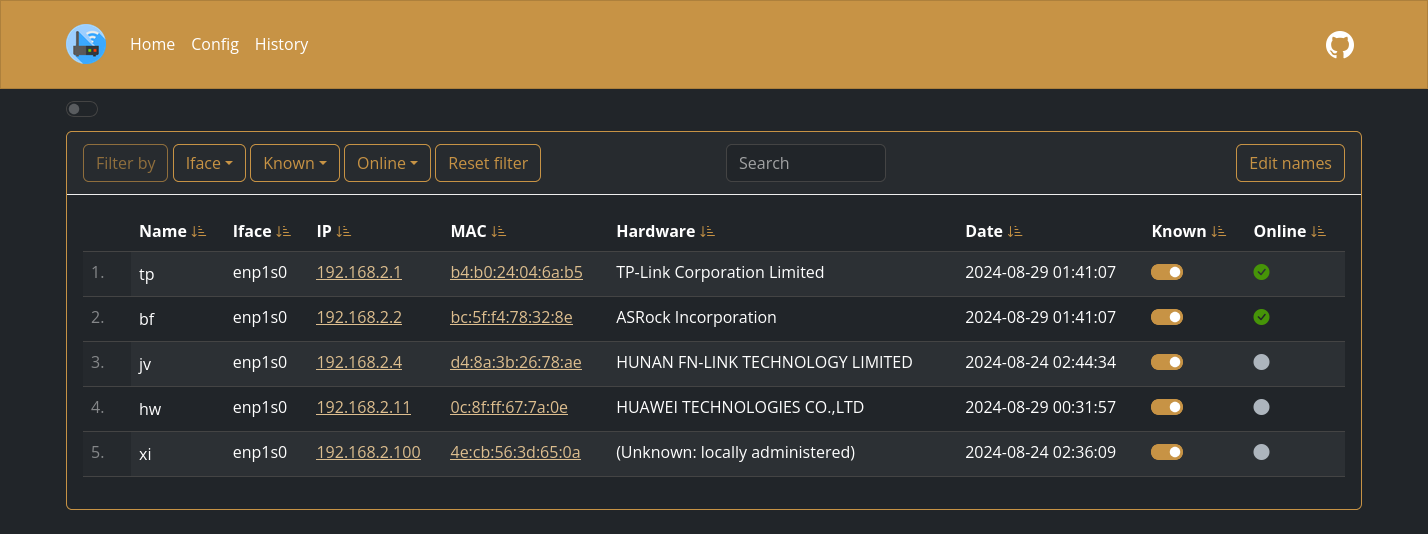
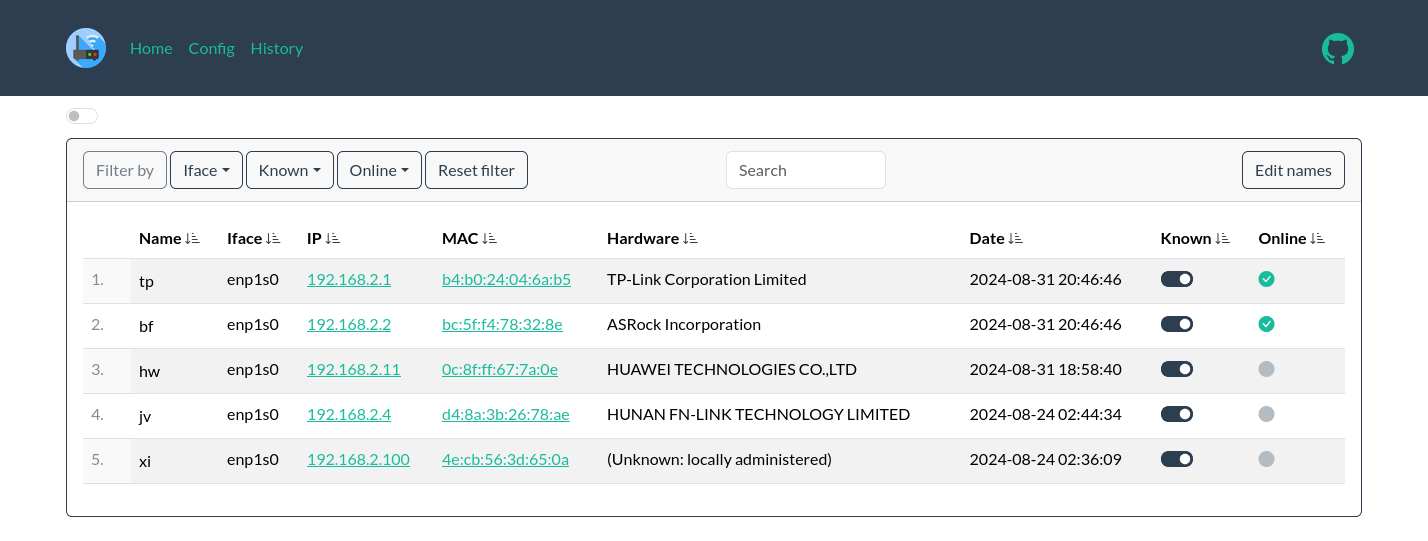
Web GUI should be at http://localhost:8840
docker-compose
version: "3"
services:
  # node-bootstrap:                     # optional, local themes and icons
  #   image: aceberg/node-bootstrap           # dockerhub
  #   # image: ghcr.io/aceberg/node-bootstrap # or github
  #   restart: unless-stopped
  #   ports:
  #   - 8850:8850
  wyl:
    image: aceberg/watchyourlan           # dockerhub
    # image: ghcr.io/aceberg/watchyourlan # or github
    network_mode: "host"
    restart: unless-stopped
    # uncomment those if you are using local node-bootstrap:
    # command: "-n http://YOUR_IP:8850"   # put your server IP or DNS name here
    # depends_on:
    #   - node-bootstrap
    volumes:
    - ~/.dockerdata/wyl:/data/WatchYourLAN
    environment:
      TZ: Asia/Novosibirsk              # required: needs your TZ for correct time
      IFACES: "enp4s0 wlxf4ec3892dd51"  # required: 1 or more interface
      # HOST: "0.0.0.0"                   # optional, default: 0.0.0.0
      # PORT: "8840"                      # optional, default: 8840
      # TIMEOUT: "120"                    # optional, time in seconds, default: 120
      # SHOUTRRR_URL: ""                  # optional, set url to notify
      # THEME: "sand"                     # optional
      # COLOR: "dark"                     # optional
Bianry
All binary packages can be found in latest release. There are .deb, .rpm, .apk (Alpine Linux) and .tar.gz files.
Supported architectures: amd64, i386, arm_v5, arm_v6, arm_v7, arm64.
Dependencies: arp-scan, tzdata.
For amd64 there is a deb repo available
API
Returns all hosts in json.
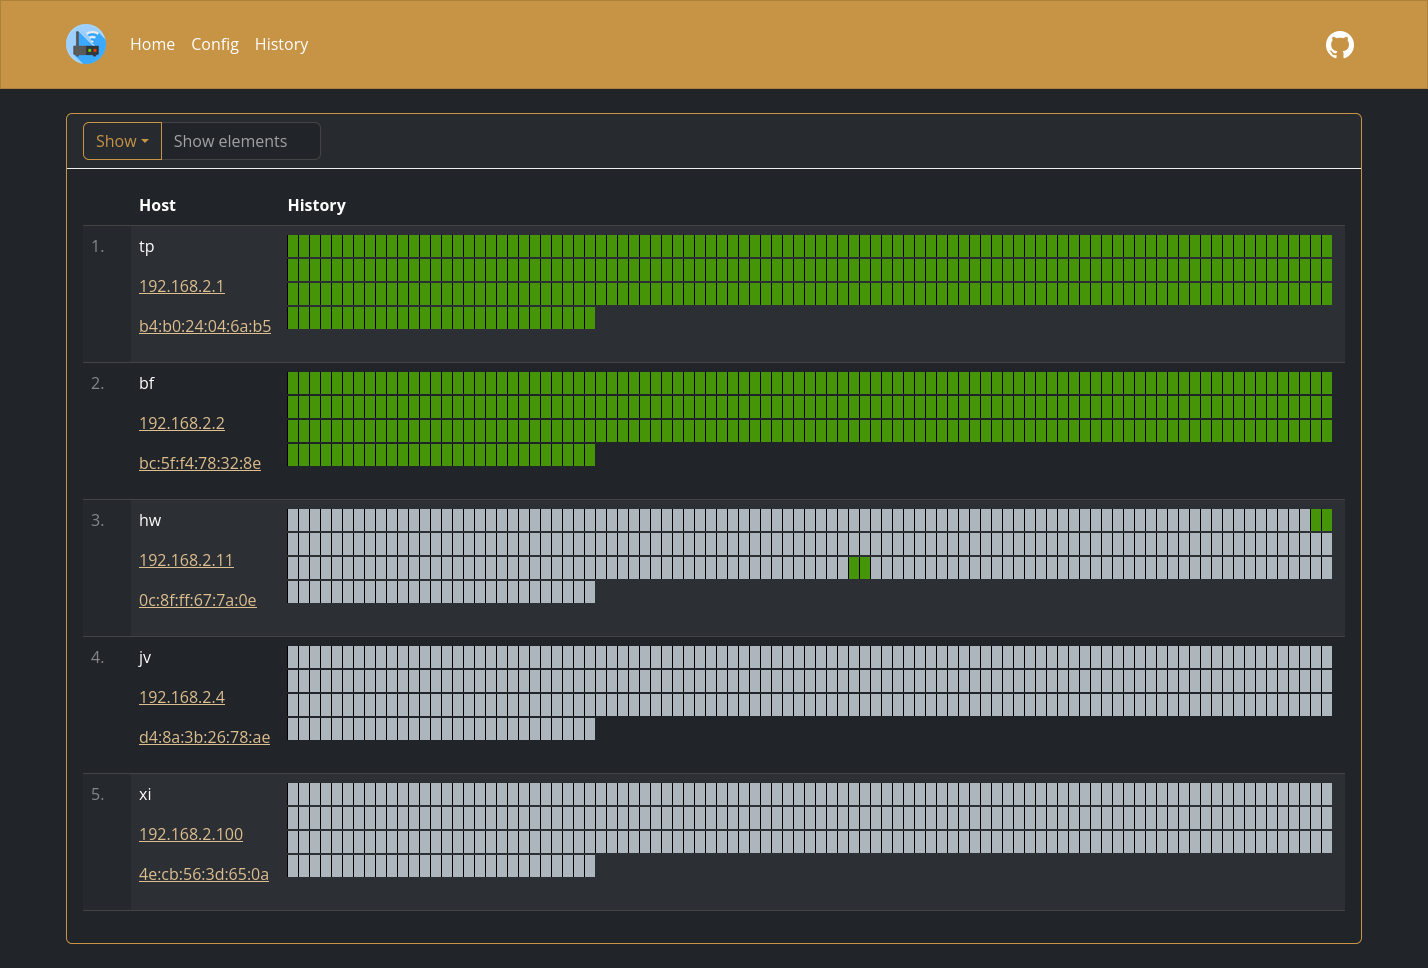
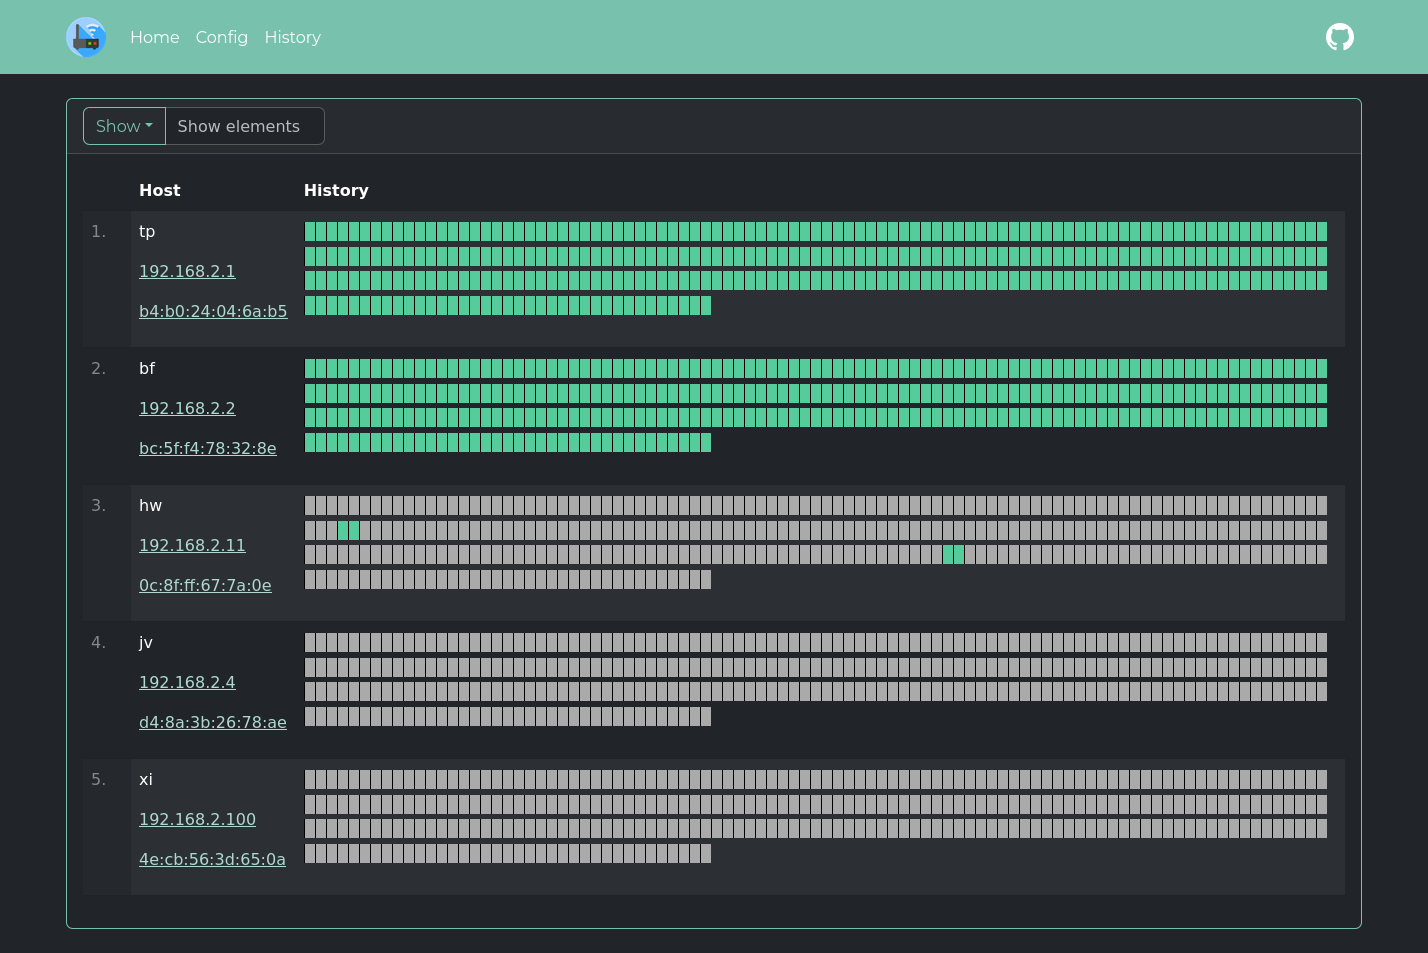
Returns all History. Not recommended, the output can be a lot.
GET /api/history/:mac/:date
Returns only history of a device with this mac filtered by date. date format can be anything from 2 to 2025-07 to 2025-07-26.
GET /api/history/:mac?num=20
Returns only last 20 lines of history of a device with this mac.
Returns host with this id in json.
GET /api/port/:addr/:port
Gets state of one port of addr. Returns true if port is open or false otherwise. Request example:
curl "http://0.0.0.0:8840/api/port/192.168.2.2/8844"
GET /api/edit/:id/:name/*known
Edit host with ID id. Can change name. known is optional, when set to toggle will change Known state.
Remove host with ID id.
Send test notification.
Show status (Total number of hosts, online/offline, known/unknown). The iface parameter is optional and shows status for one interface only. For all interfaces just call /api/status/.